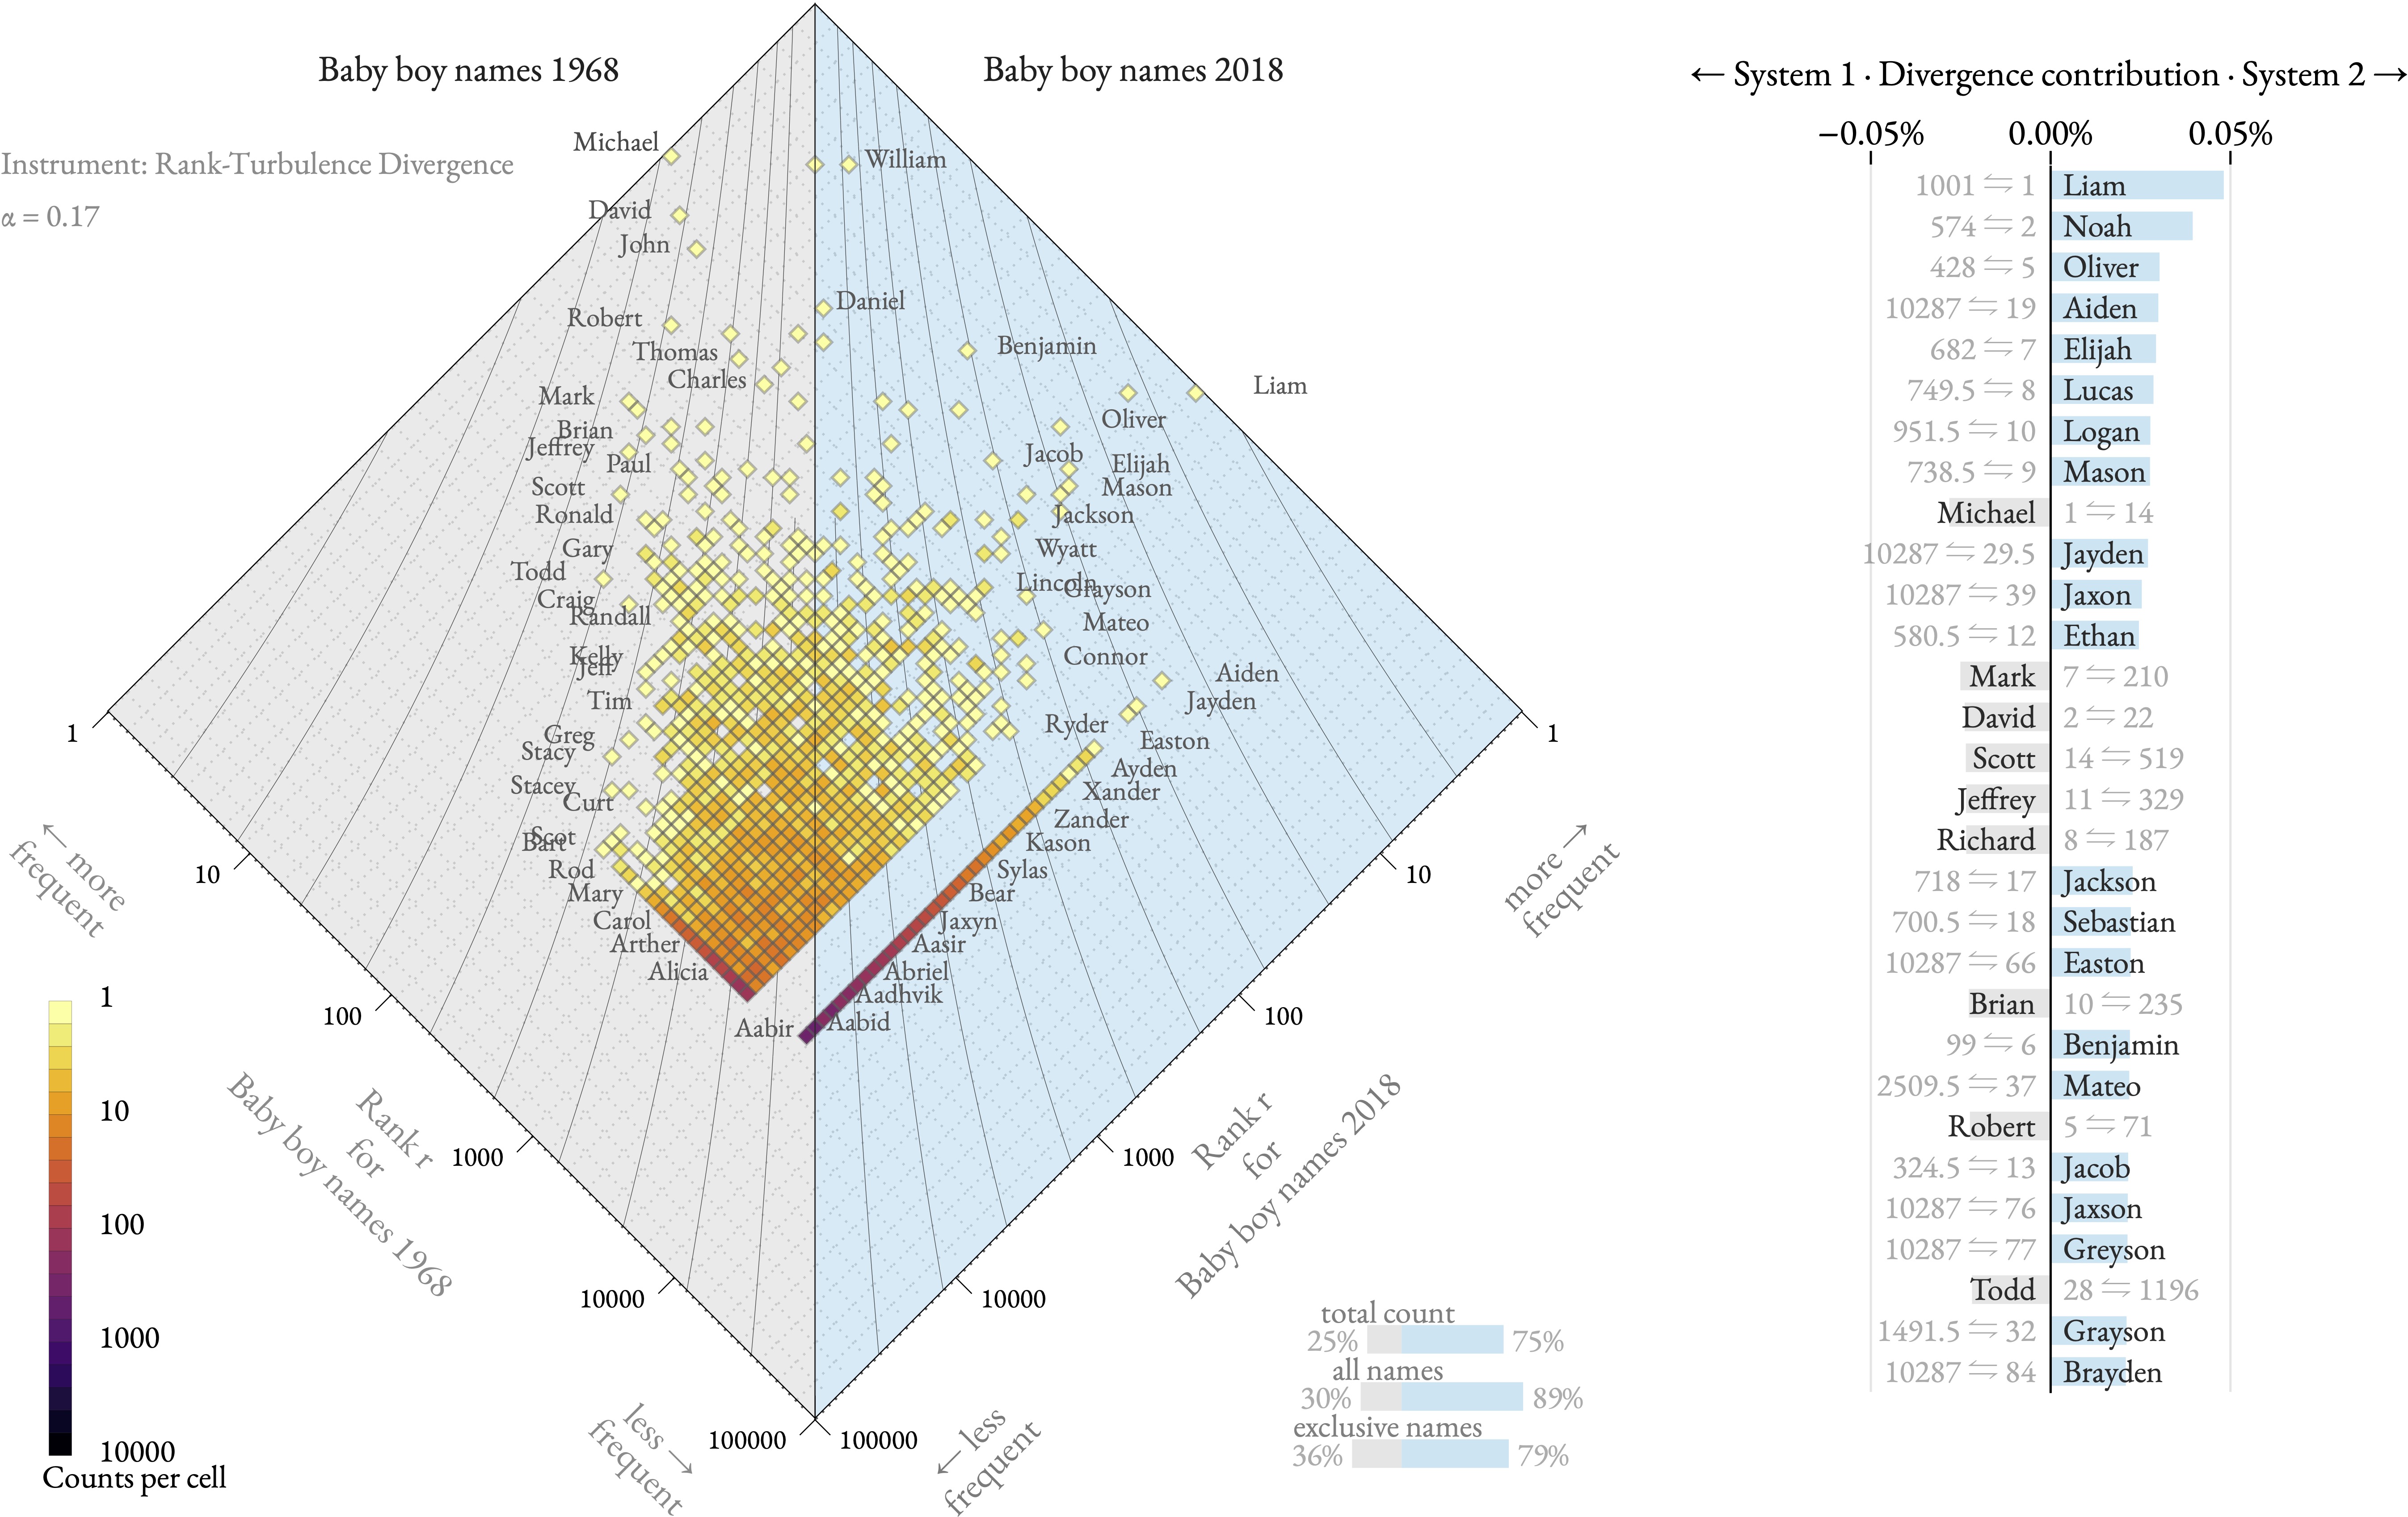
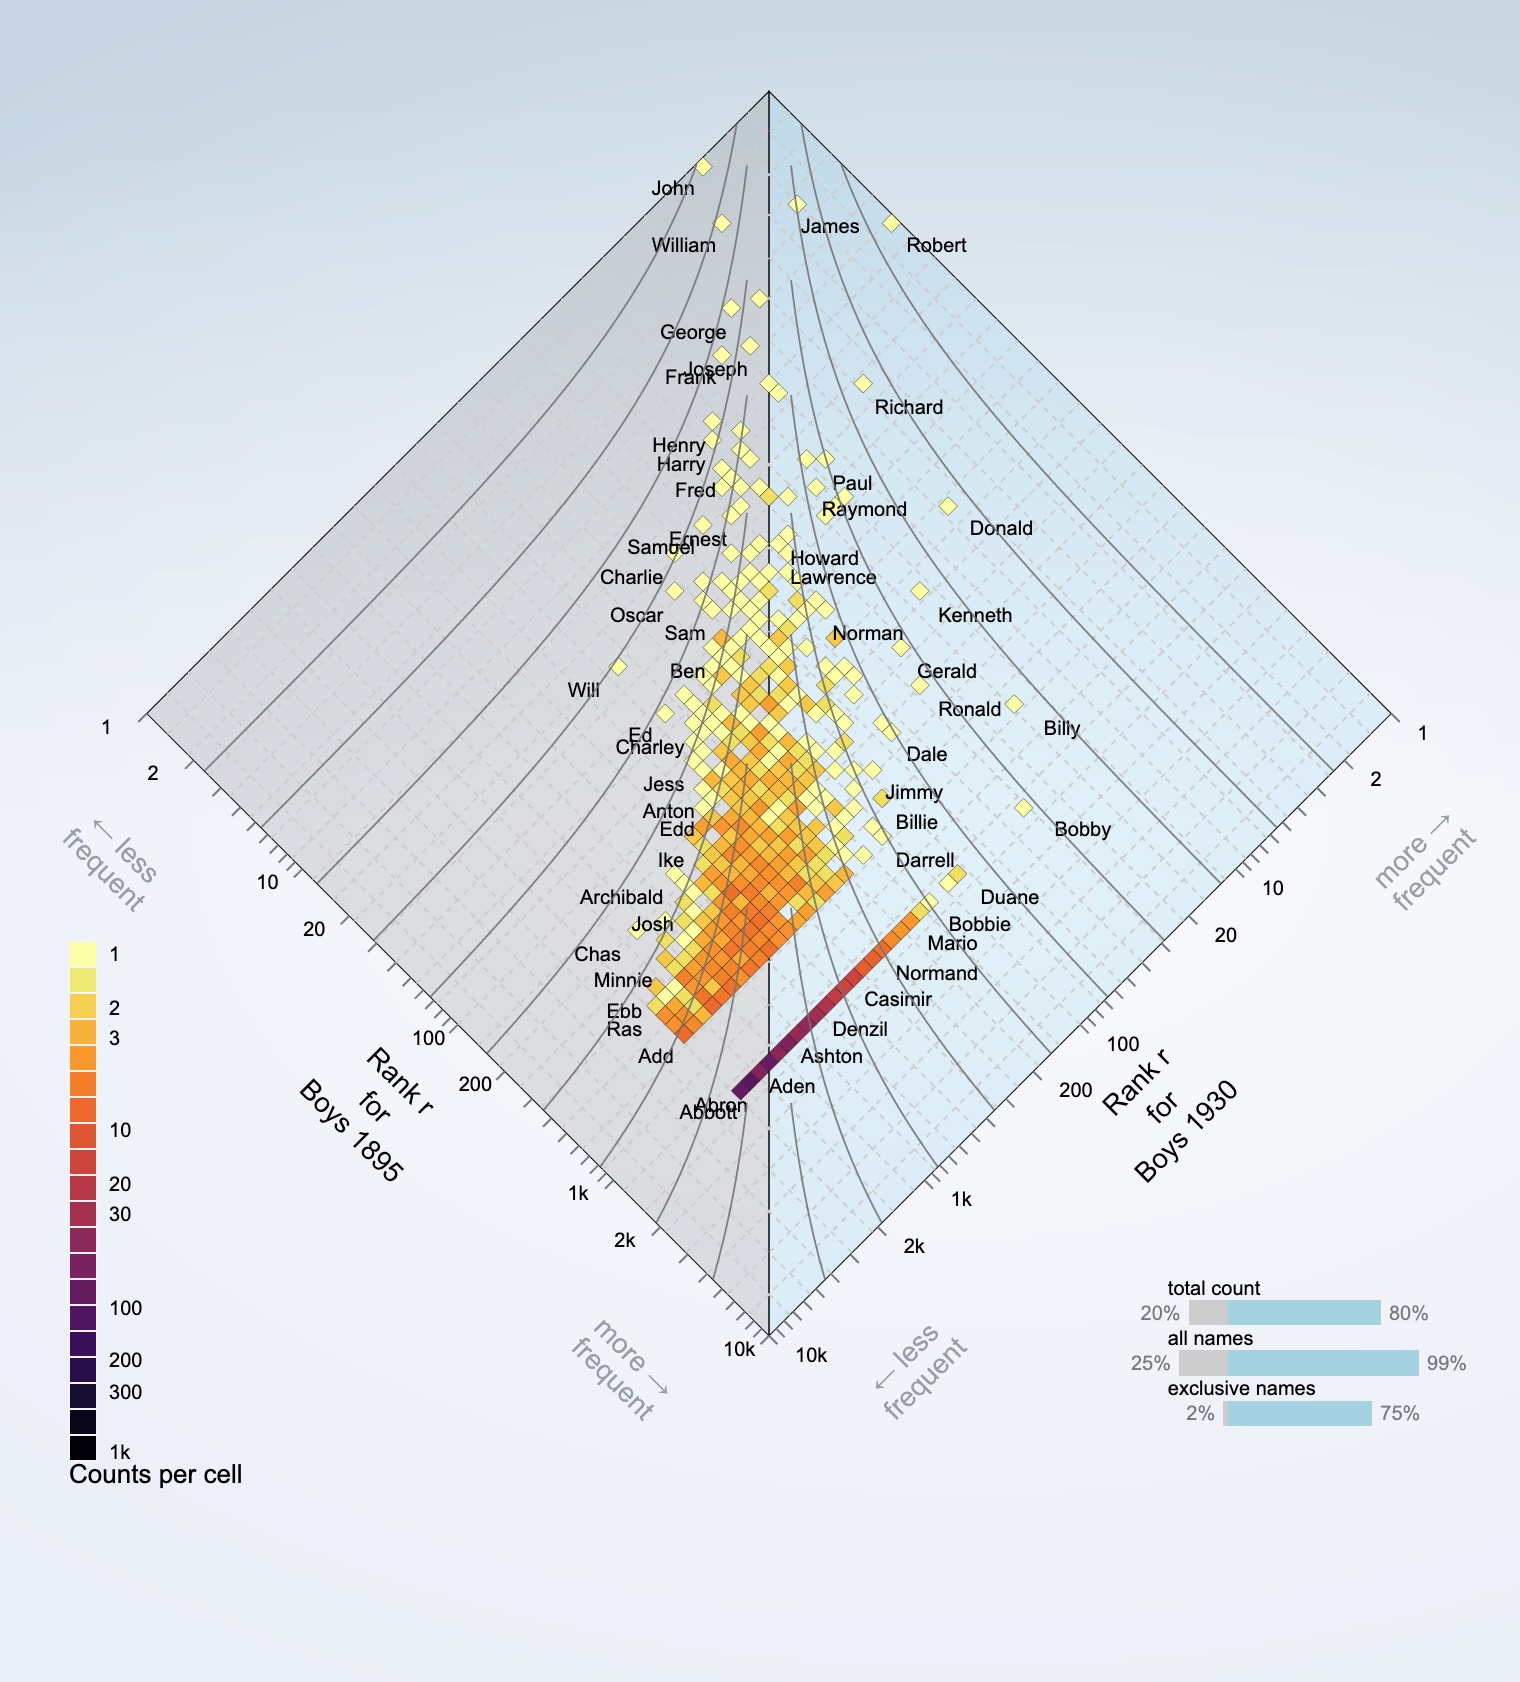
The allotaxonograph is a scientific tool developed by the Computational Story Lab to compare any pairs of systems with meaningfully rankable components. For instance, consider the popularity of baby names across different time periods. Baby name frequencies follow a heavy-tailed distribution—a few names are very popular, occurring an order of magnitude more frequently than rarer names. The allotaxonograph allows us to compare these popularity patterns while accounting for the heavy-tailed nature of the data. Originally designed to understand complex systems, this tool could benefit a broader audience, including policy makers and applied scientists.
The thing is that some people only want to use the tool programmatically, say from a jupyter notebook using the Python programming language. Others only want a drag and drop approach, where they just want to drop their data on a standalone page and be able to download the results. At the institute, this has led to the following question:
How can we make tools from complex systems available to a diversity of users?
The allotaxonometer-ui library is one answer to this challenge.
Inspired by bits-ui, allotaxonometer-ui is a Javascript library that lets us share web components and utility functions to build and visualize the allotaxonograph. It is npm-installable, but callable from python using the subprocess module (the same approach could be generalized to other scientific programming languages). It underlies the following projects and stories:
ALLotaxonometry
A whirlwind tour of the allotaxonometer

py-allotax
A nice feature with allotaxonometer-ui is that you can either import the full allotaxonograph, here using the Svelte framework:
<script>
  import { Allotaxonograph } from 'allotaxonometer-ui';
  import {
    combElems,
    rank_turbulence_divergence,
    diamond_count, wordShift_dat,
    balanceDat
    } from 'allotaxonometer-ui';

  import boys1895 from '$data/boys-1895.json';
  import boys1968 from '$data/boys-1968.json';

  let alpha = $state(0.58); // $state() runes to make α reactive

  let me = combElems(boys1895, boys1968); // combine both systems
  let rtd = $derived(rank_turbulence_divergence(me, alpha)); // $derived() runes since α is reactive
  let diamondCountData = $derived(diamond_count(me, rtd));

  let max_count_log = $derived.by(() => {
    const maxValue = d3.max(diamondCountData.counts, d => d.value);
    return Math.ceil(Math.log10(maxValue)) + 1;
  });

  // Do the rest of data processing steps
  // ...
</script>

<Allotaxonograph
    dat={diamondCountData}
    {alpha}
    divnorm={rtd.normalization}
    {max_count_log}
    <!-- rest props... -->
/>
Or individual components, which can be used with more granularity in scrollytelling:
<script>
  import { Diamond, Legend } from 'allotaxonometer-ui';
  import { fade, fly } from 'svelte/transition';

  // Same data processing steps.
  // ..
</script>

<div class="diamondplot">
  <Diamond
      dat={diamondCountData}
      {alpha}
      divnorm={rtd.normalization}
      DiamondHeight={600}
      />
</div>
<!-- scrollyStep here is a reactive variable tracking user scroll -->
{#if scrollyStep >= 1}
  <div class="additional-charts"
      in:fade={{ duration: 800, delay: 300 }}
      >
    <div class="legend-container"
          in:fly={{ x: -50, duration: 600, delay: 500 }}>
          <Legend
              diamond_dat={diamondCountData.counts}
              DiamondHeight={815}
              {max_count_log}
          />
      </div>
  </div>
{/if}
where in both cases is the parameter in the rank divergence metric , and is the rank of a type, say a baby name. See this simple app for the rest of the code example, and the foundational paper for a description of the metric.
The old gods
To better understand the contribution, we should consider first what researchers typically do when they develop new tools. If they believe in the ideals of open science, they might release their code, as with the original allotaxonometer's matlab version. But as "amateur software developers", the code might be of varying quality in terms of maintainability and accessibility. Most scientists are not professional developers, and even if they are it takes time to improve computer code such that it is accessible. Hence, the code might be released, but more or less easy to access for researchers around the world.
The code will also be written in a scientific programming language, which more often than not is not designed for the web. This makes it difficult to translate from the static world to the interactive, browser-based world through which most people discover new content. So, what do we need to make tools like the allotaxonograph maintainable and shareable?
The voyage begins
We iterated a few versions before getting to allotaxonometer-ui. We tried to chart the allotaxonograph in python, but the various transforms to make the diamond plot weren't easily done in matplotlib or some other charting libraries. We had a bit more luck with R, even using Shiny as a tool to make the reactive app, but we ran into challenges when we sought to extend dashboard capabilities. Shiny is nice, but ultimately d3js was the tool of choice for the job, being designed to easily manipulate the Document Object Model (DOM). With that in hand, we only needed to find a way to go back into scripting in python.
We separated the computing required for the allotaxonograph from the charting code, each put in their own codebase. So we had charting code for the static plot used in py-allotax, and another codebase for the interactive world. The problem with that is that any work put on one chart wouldn't benefit the other one. It would be nice to use our fancy web components to chart in the python world, but the issue is that when dealing with static charts, the DOM is not accessible.
Long story short, the key to using web components to produce a static version of the allotaxonograph was to write hybrid code that is both Server-Side Renderable (SSR) and that can run on the client side. Being from the sciences, it is not something that any of us on the team were familiar with. We will write a more detailed explanation of the solution in another post, but the gist is that the allotaxonograph is as follows:
- SSR: The visualization is generated as complete HTML on the server, ensuring it's immediately visible and works everywhere
- Client-Side: When JavaScript loads, the same components become fully interactive with tooltips, hover effects, and dynamic updates
Making d3-powered visualizations work in both contexts required careful engineering. D3 expects a DOM to exist, but SSR happens before any DOM is available. We had to write our Svelte components to handle mathematical calculations server-side while preserving full interactivity client-side. This meant shipping two builds: one optimized for Node.js servers and another for browsers.
Looking ahead
Researchers can now embed the allotaxonograph in static websites, generate publication-ready PDFs with embedded graphs, or share them via simple hosting - no complex server infrastructure required. The visualizations are accessible, archival-friendly, and still provide rich interactivity when possible. We'll dive deeper into the technical implementation in another post, but the key insight was that modern web frameworks like Svelte make this kind of hybrid rendering achievable, even for teams coming from scientific rather than web development backgrounds.
But we're not done. Borrowing more extensively from bits-ui, we could expose more subcomponents of the allotaxonograph (down to the contour lines, or axis) so that we give full power to web developers. The library still could be optimized for speed in many ways. As library, the allotaxonometer-ui can be tested more, as well as extended in a systematic fashion to bring new collaborators (such as students) to incorporate more metrics.