Open Source Programs Offices (OSPOs) help organizations adopt open source solutions to digital challenges. They grew out of technology companies' growing realization that dedicated teams of open source enthusiasts could effectively guide their developers through open source software development—from licensing to design patterns and code reusability.
At the Vermont Research Open-Source Program Office (VERSO), we help research groups adopt best practices in research software development. As an OSPO, we share the belief that academia can benefit from having a small team of open source enthusiasts that can effectively guide research groups in navigating open source software development.
We recognize that research groups operate under different constraints and may hold different ideas about the value of good coding practices than industry does. After all, research groups are not tech companies. That said, academia can learn tremendously from how modern organizations handle the challenges of hyperscale technologies, while recognizing when industry practices do not always apply to research.
This blog will show how and when adopting best practices in research software development creates value. We showcase research projects through scientific data essays, then use blog posts as a kind of "behind the scenes" to explain what open source practices proved useful and why. We don't shy away from showing Python code, as you will see below. But we make an effort to stay at a relatively high level, accessible to most.
A first case study: principled data processing using dagster
One approach to messy, collaborative projects is principled data processing (PDP). It is an approach to the data life cycle where researchers adopt a modular workflow; they write scripts that take some input, do some atomic tasks, and produce a single output. This logic is encoded in the project structure, and subsequently serves as documentation for reproducibility and maintainability ("the code is the documentation"). PDP exemplifies what we mean by "good practices" in research software engineering—an alternative to the common research habit of hacking together duct-tape software solutions that "just work".
We show how to implement PDP using the data orchestration tool dagster. We take as an example the open academic analytics, which aims to provide a broad picture view of the UVM research ecosystem at the group level. The immediate contribution of this project is a web interface where users can explore how scientific productivity coevolves with collaborations for faculty at the University of Vermont. One question we have while building this interface is the following:
What research groups are there at the University of Vermont? Do they collaborate with each other?
With that in hand, we can ask more specific questions such as how do they manage recurrent research software development challenges, and perhaps we can step in to help with that. More theoretically, we are interested in scientific questions, such as how collaborator diversity in terms of age and institutions impacts the content of research of a given faculty member (whom we call "ego").
The open academic analytics project is messy; we hand annotate faculty on whether they have research groups or not (which requires philosophical legwork), we call the openAlex API to access research metadata (which is noisy and imperfect), we wrangle data to build relevant features, and we build models to answer scientific questions. To manage and visualize our dependency graphs between our tasks, we use dagster. As a data orchestration tool, we build such dependency graphs as assets that can be schematized as follows:
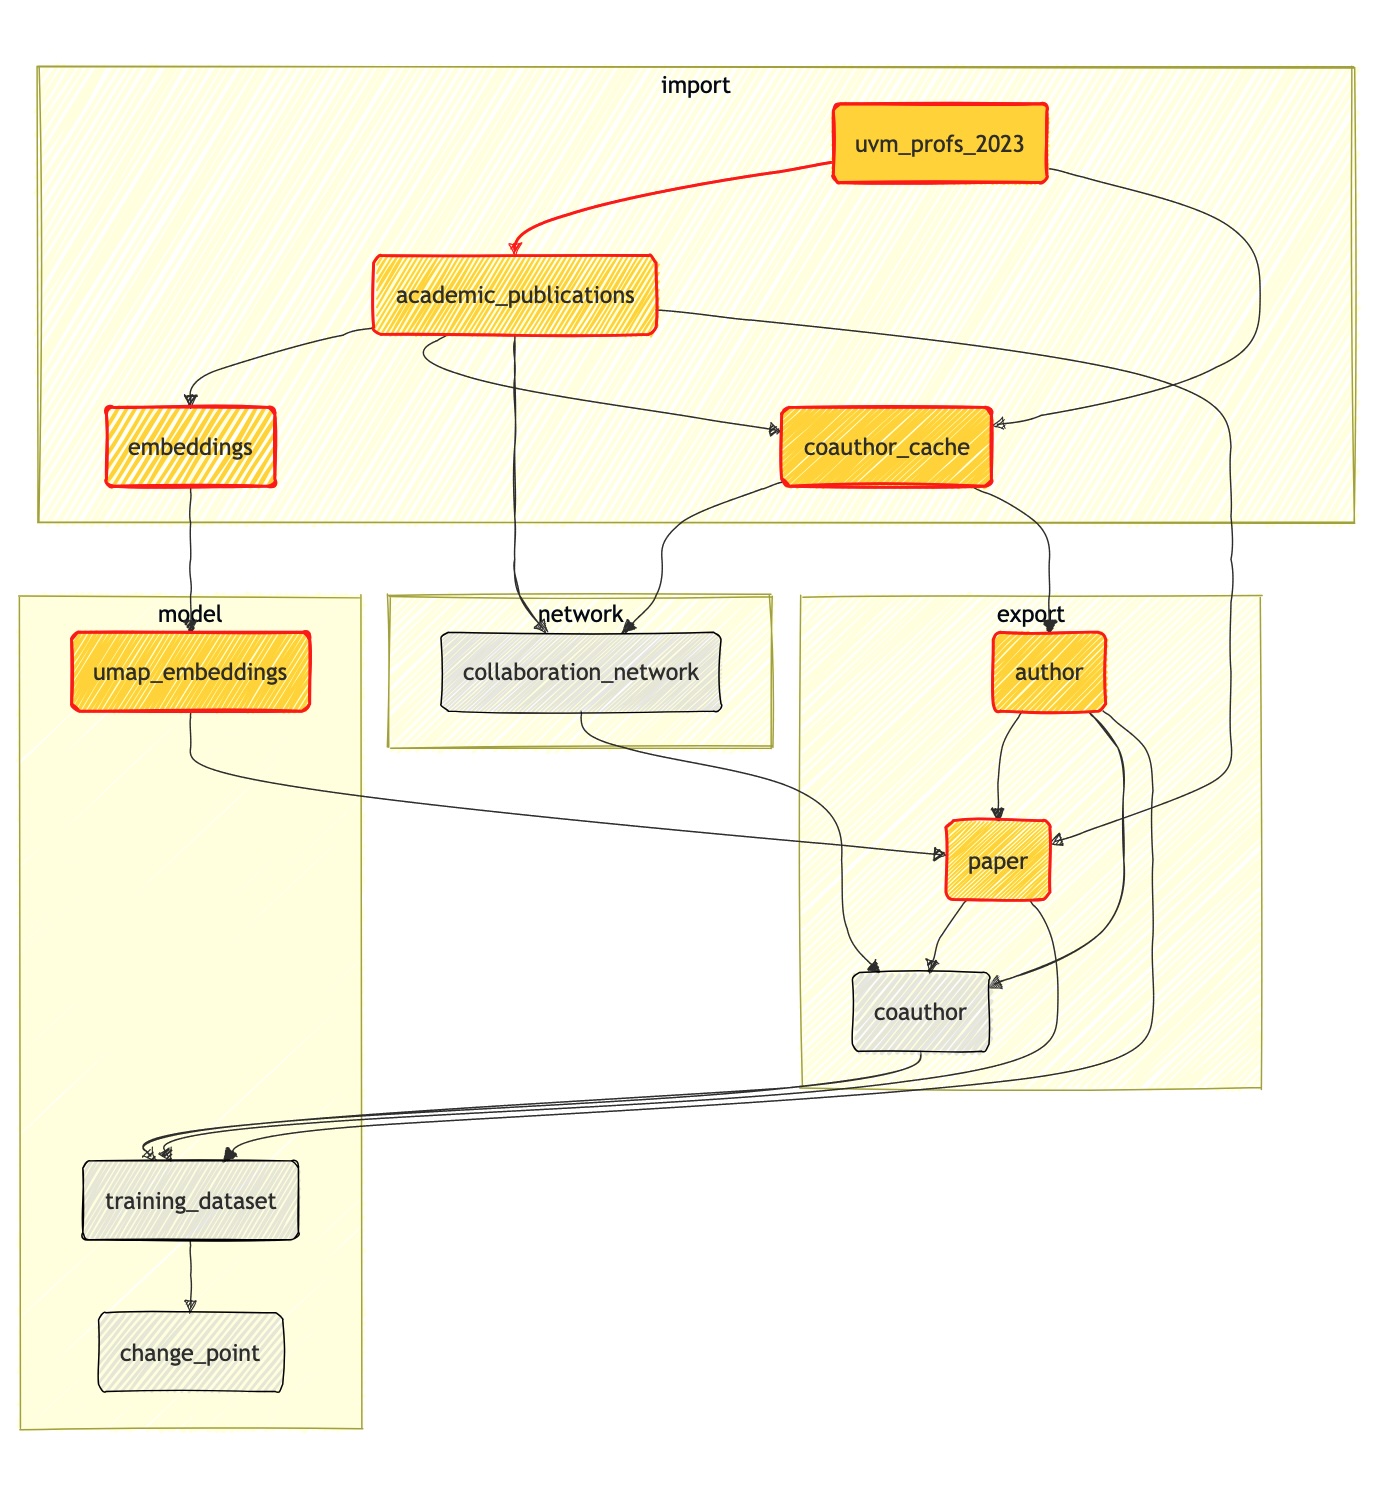
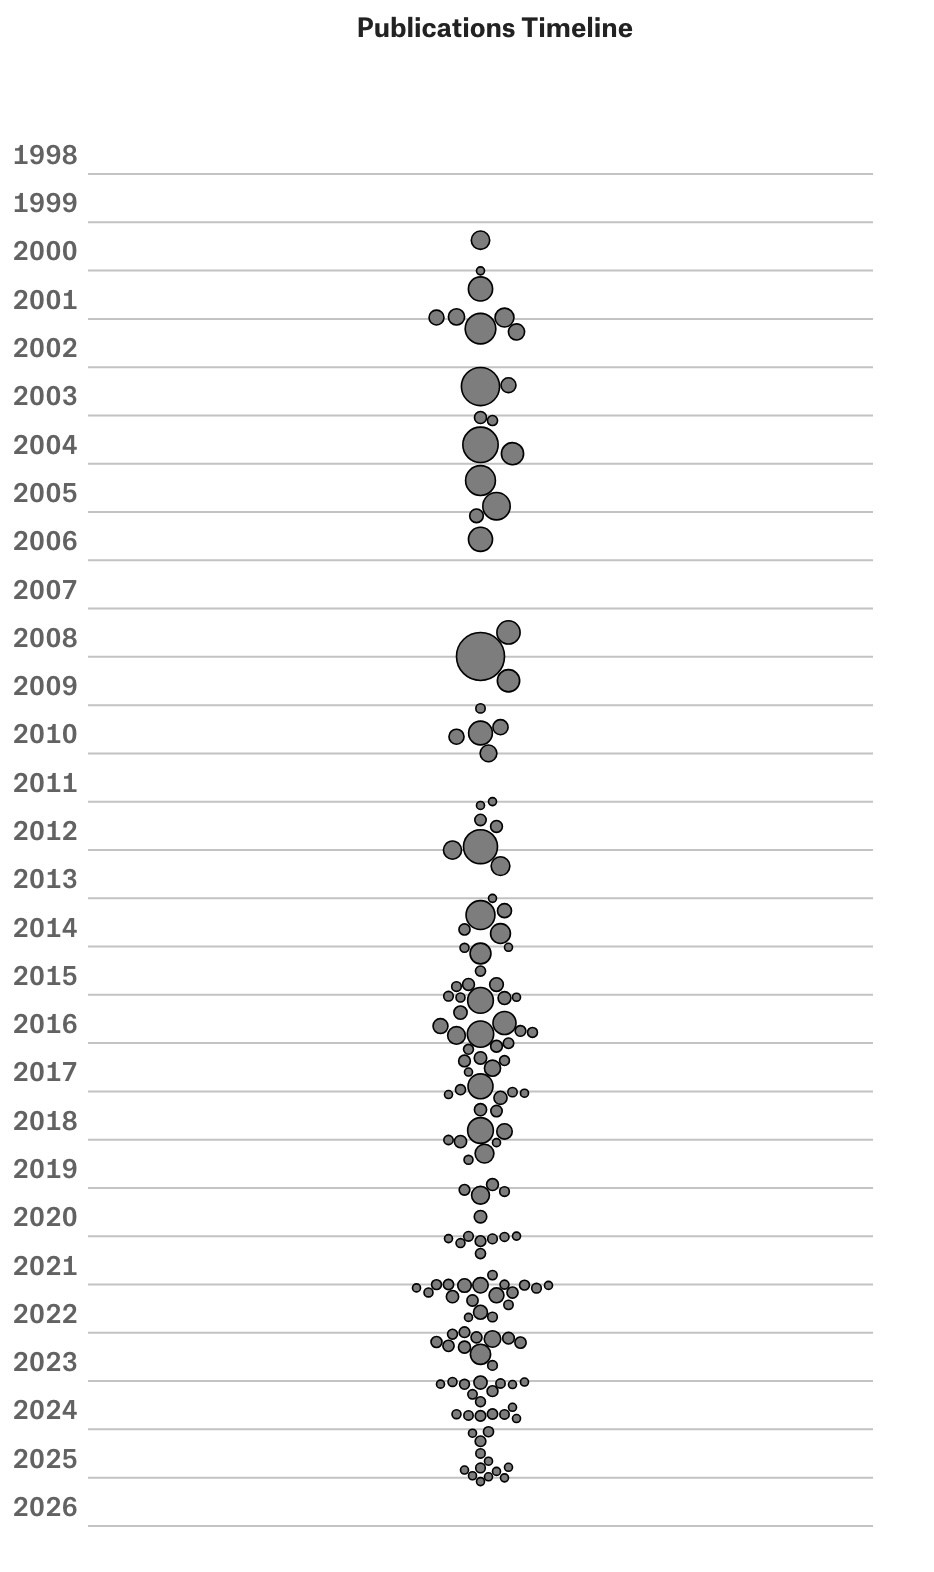
To illustrate how dagster works, we focus on the steps of going from raw data to the paper timeline chart, where node size is proportional to the number of citations. Our first asset uvm_departments is about checking the availability and downloading an upstream file that lives in our complex-datasets repository:
import requests
import pandas as pd
from dagster import asset, get_dagster_logger
from dagster import MaterializeResult, MetadataValue
from config import config

@asset(
    group_name="import",
    description="📋 UVM Professors 2023 dataset from Vermont Complex Systems",
)
def uvm_profs_2023():
    """
    Fetches and processes UVM professors dataset from Vermont Complex Systems.
    """
    logger = get_dagster_logger()

    base_url = 'https://vermont-complex-systems.github.io'
    dataset_url = f"{base_url}/datasets/data/academic-research-groups.csv"
    output_file = config.data_raw_path / config.uvm_profs_2023_file

    try:
        logger.info(f"Checking availability: {dataset_url}")
        head_response = requests.head(dataset_url, timeout=10)

        if head_response.status_code == 200:
            file_size = head_response.headers.get('content-length', 'Unknown')
            last_modified = head_response.headers.get('last-modified', 'Unknown')

            logger.info(f"✓ Dataset available")
            logger.info(f"  File size: {file_size} bytes")
            logger.info(f"  Last modified: {last_modified}")
        else:
            raise Exception(f"Dataset not available. HTTP {head_response.status_code}")

    except Exception as e:
        logger.warning(f"Availability check failed: {e}")
        logger.info("Proceeding with download attempt...")

    # Download and process
    try:
        df = pd.read_csv(dataset_url)

        expected_columns = ['department', 'college', 'inst_ipeds_id', 'year']
        if not all(col in df.columns for col in expected_columns):
            raise Exception(f"Missing expected columns. Found: {list(df.columns)}")

        # Select year and UVM
        df = df[(df.inst_ipeds_id == 231174) & (df.year == 2023)]

        # Reorder columns for pipeline consistency
        column_order = [
            'oa_display_name', 'is_prof', 'group_size', 'perceived_as_male',
            'host_dept', 'college', 'has_research_group', 'oa_uid', 'group_url', 'first_pub_year',
            'payroll_name', 'position', 'notes'
        ]

        df = df[column_order]

        # Save to file
        df.to_parquet(output_file, index=False)

        return MaterializeResult(
            metadata={
                "external_file": MetadataValue.path(str(dataset_url)),
                "output_file": MetadataValue.path(str(output_file))
            }
        )
    except Exception as e:
        logger.error(f"Failed to download/parse CSV: {e}")
        raise
First, note that implementing dagster is a matter of adding decorators to functions, which makes it easy to integrate into an existing pipeline. We enforce the PDP philosophy of writing input-output tasks ourselves. Our input is dataset_url (while checking for availability upstream) and our output is ./data/raw/uvm_profs_2023.csv (the exact path and filename is stored in our config.py file). The function performs basic filtering and checking, which we keep track of using get_dagster_logger() (distinguishing between info, warning, and error logs), and returns a MaterializeResult object, which represents a successful materialization of an asset. On our local server, we can see that the group_name, description, and other metadata will show nicely as follows:
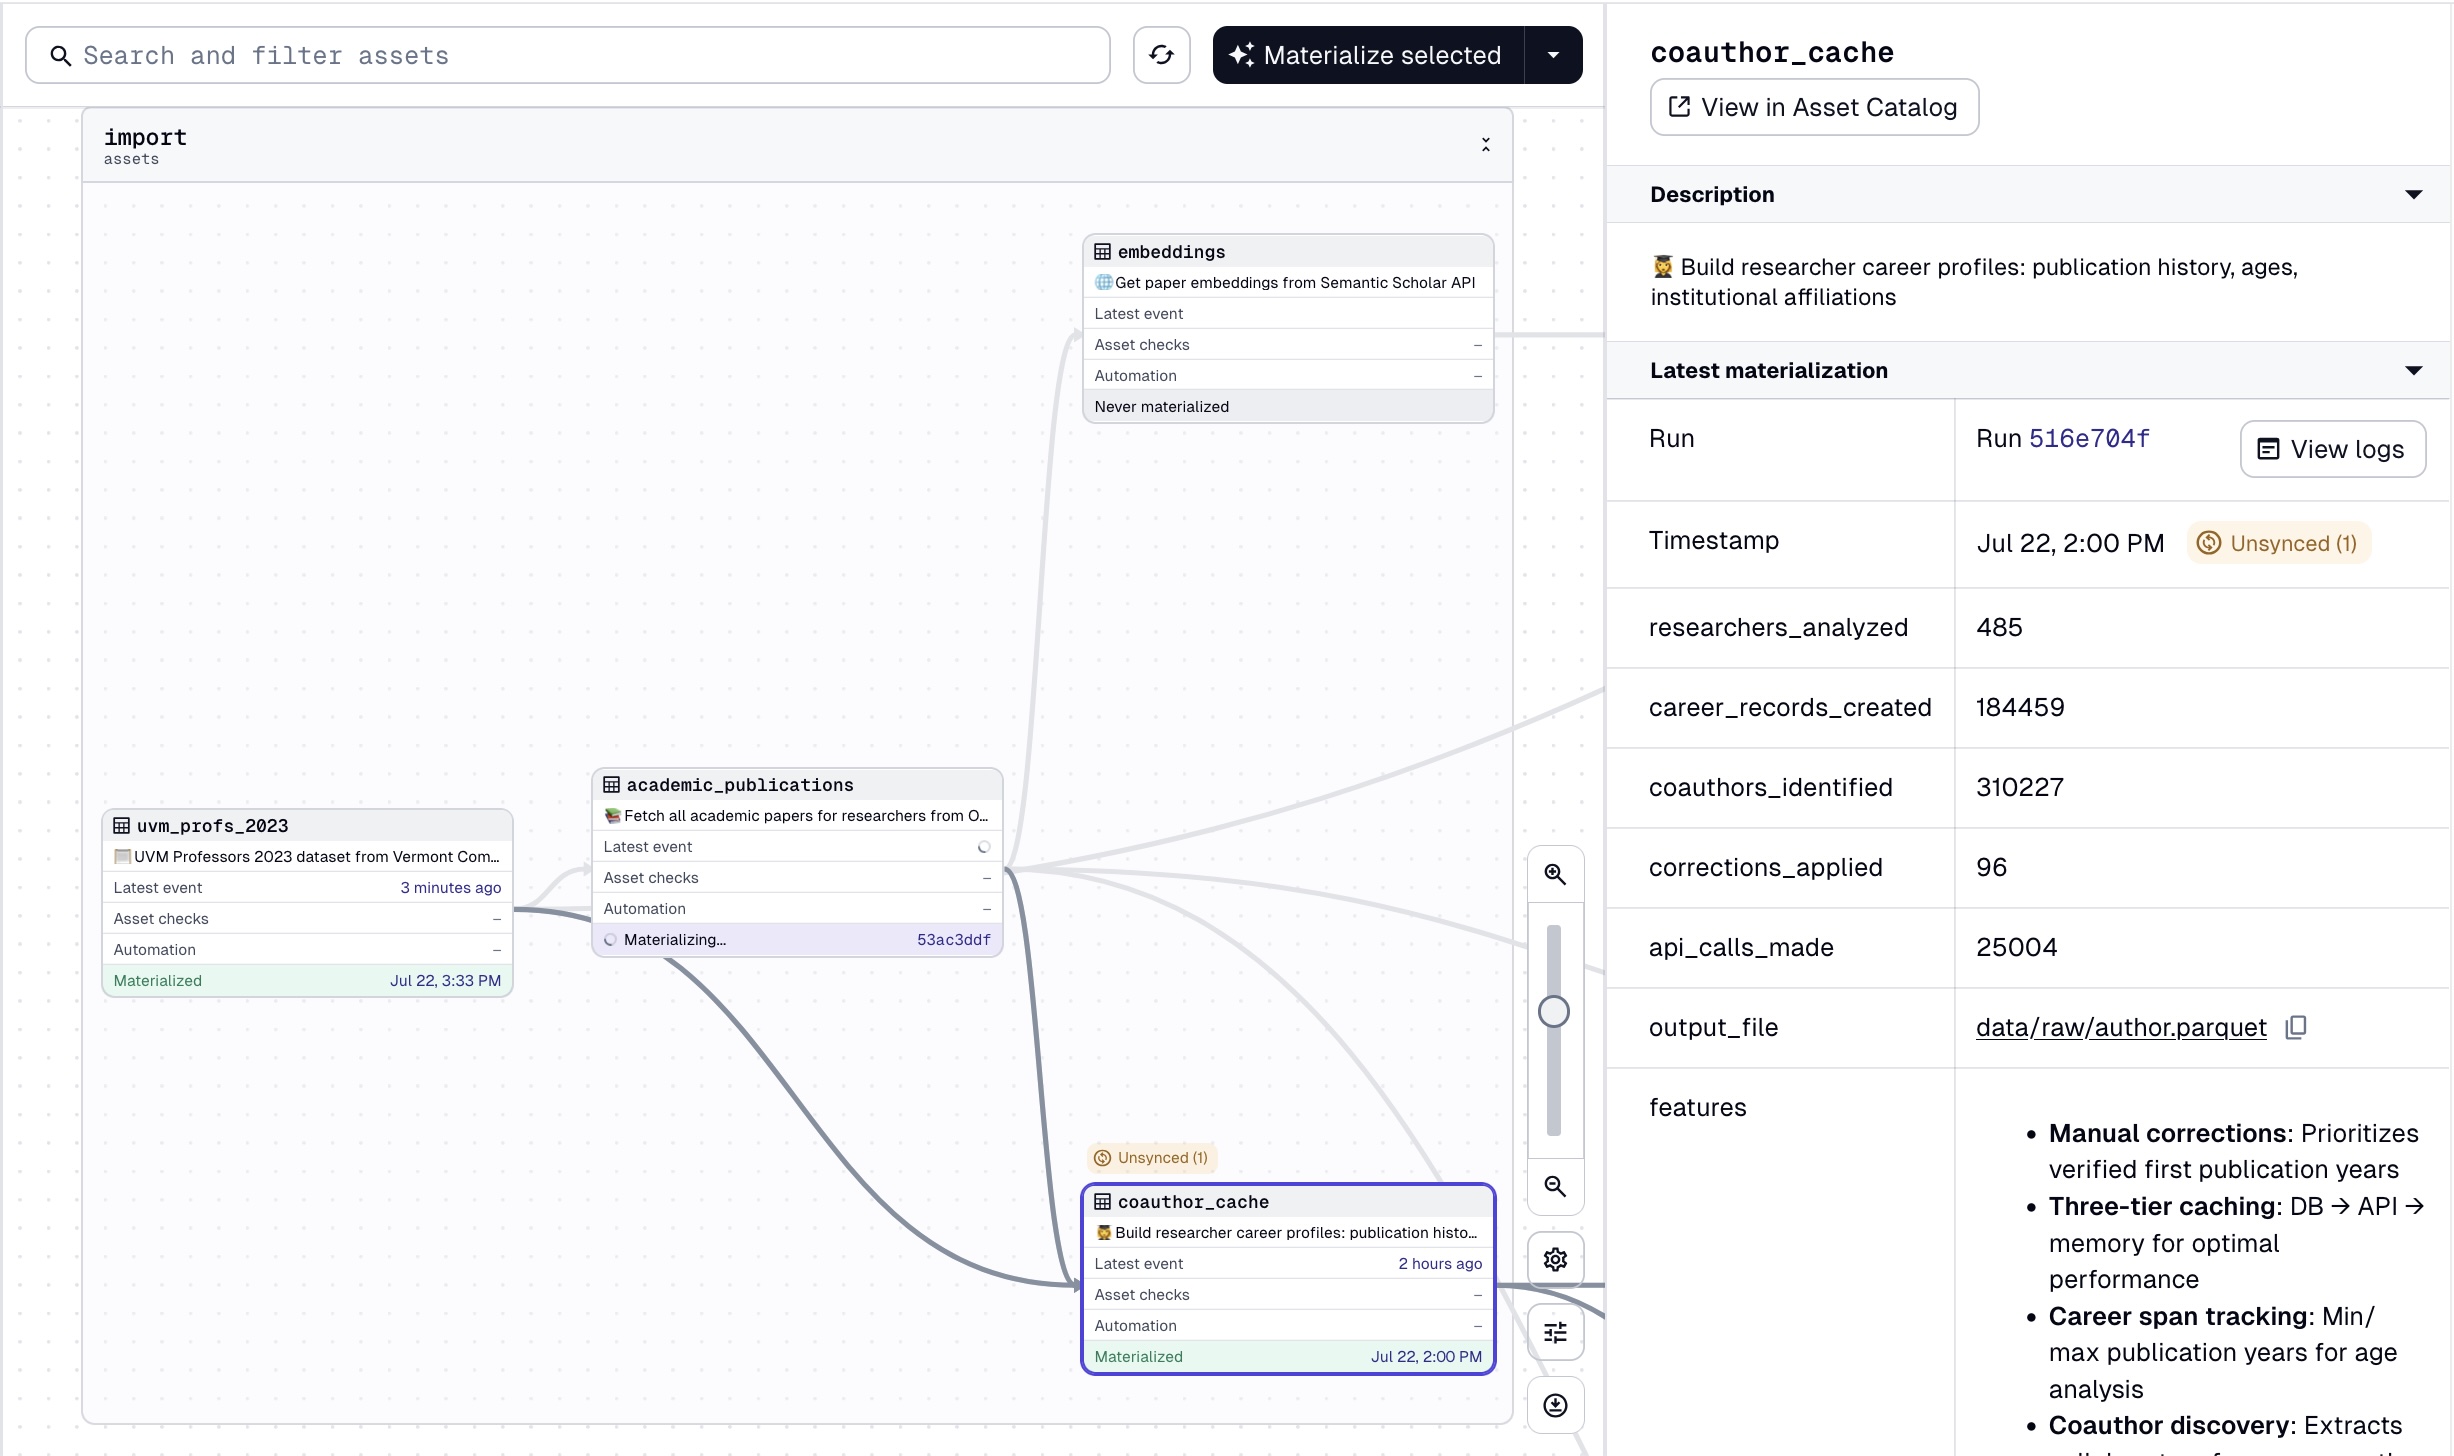
This is documentation for collaborators and our future selves! By having a simple input-output structure, we should be able to tell a story just by looking at this high-level summary of our data pipeline. If something happens to uvm_profs_2023, we know academic_publications and coauthor_cache should be rematerialized as result.
Without going into the implementation details of academic_publications, note that academic_publications is a thin wrapper over the OpenAlex API, whose role is to get the data without making any transformation to it. We do implement a caching strategy using duckdb to reduce our API calls to OpenAlex, as we want to calculate academic age for all selected authors and coauthors. To do so, we need to call for each author the first and last publication years, which is somewhat expensive. See the code for more details.
We look at the final step, where we do the data wrangling:
@dg.asset(
deps=["academic_publications"],
group_name="export",
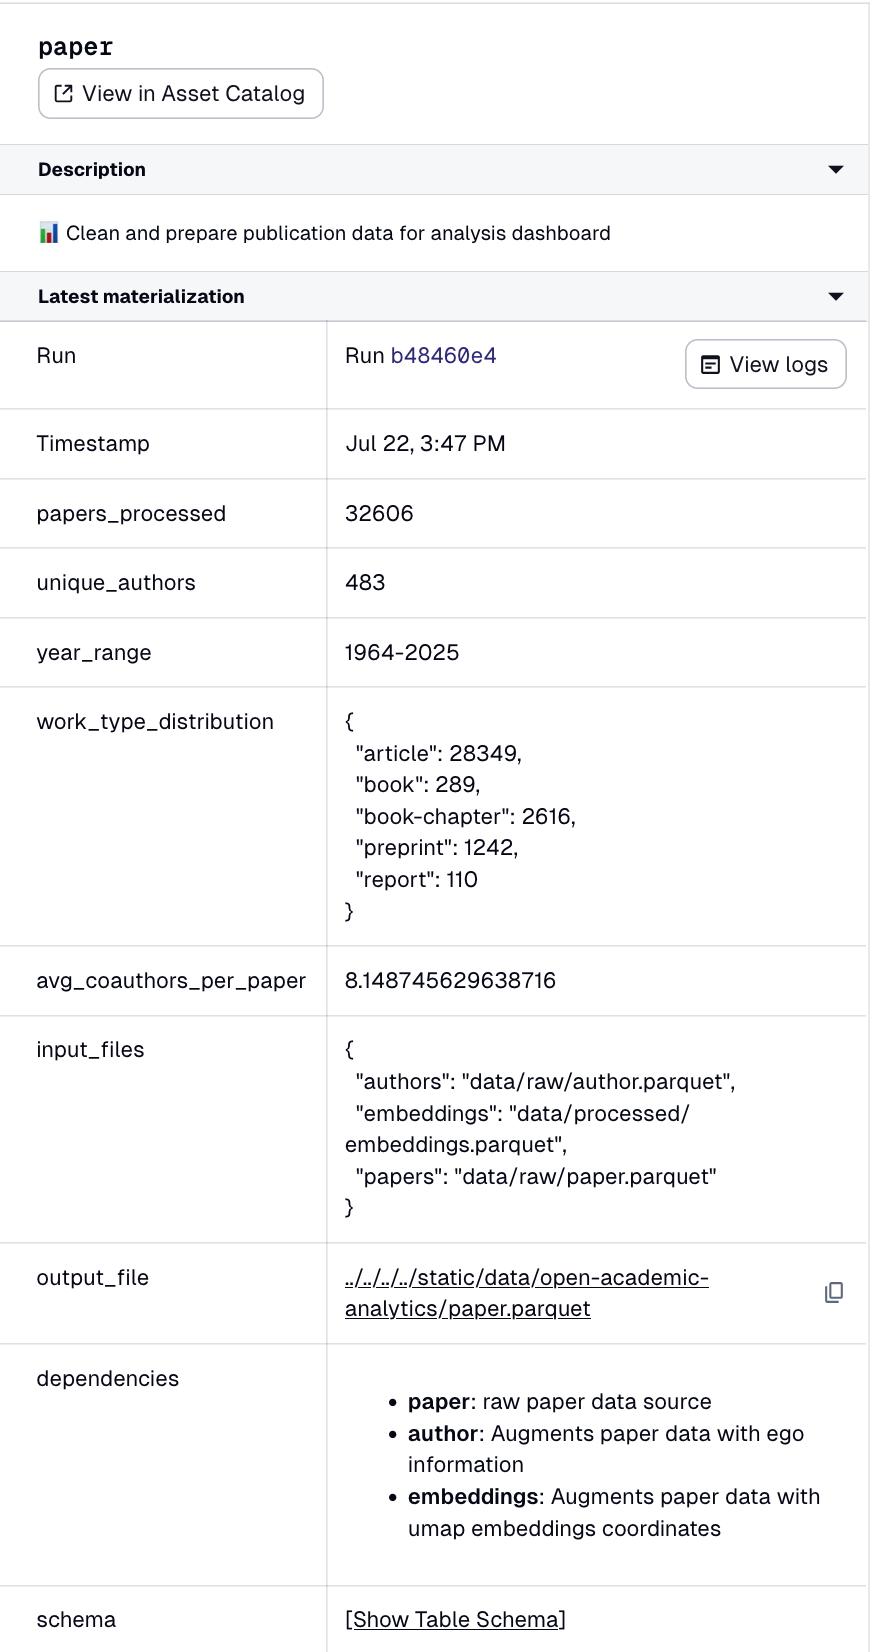
description="📊 Clean and prepare publication data for analysis dashboard"
)
def paper():
"""Process papers for visualization - filtering, deduplication, and enrichment"""
# input-output
input_file = config.data_raw_path / config.paper_output_file
output_file = config.data_export_path / config.paper_output_file
df = pd.read_parquet(input_file)
# Apply all transformations
df_processed = (df
.pipe(filter_no_title)
.pipe(prepare_for_deduplication)
.pipe(deduplicate_papers)
.pipe(filter_work_type)
.pipe(filter_mislabeled_title)
.pipe(calculate_number_authors)
.pipe(add_citation_percentiles)
)
# Generate summary statistics
work_type_dist = df_processed.work_type.value_counts().to_dict()
year_range = f"{int(df_processed.pub_year.min())}-{int(df_processed.pub_year.max())}"
avg_coauthors = float(df_processed.nb_coauthors.mean())
unique_authors = int(df_processed.ego_aid.nunique())
# Save processed data
df_processed.to_parquet(output_file)
return MaterializeResult(
metadata={
"papers_processed": MetadataValue.int(len(df_processed)),
"unique_authors": MetadataValue.int(unique_authors),
"year_range": MetadataValue.text(year_range),
"work_type_distribution": MetadataValue.json(work_type_dist),
"avg_coauthors_per_paper": MetadataValue.float(avg_coauthors),
"input_file": MetadataValue.path(str(config.data_raw_path / config.paper_output_file)),
"output_file": MetadataValue.path(str(output_file)),
"dashboard_ready": MetadataValue.bool(True),
"research_value": MetadataValue.md(
"**Publication timeline dataset** ready for dashboard visualization. "
"Shows researcher productivity, collaboration breadth, and career progression."
)
}
)
We take advantage of pandas functional style, piping helper functions in a specific order. Even though we don't show those functions, you should have a clear idea of what is happening. We also keep track of summary statistics in the process, for debugging purposes. For instance, if you look at the current year-range field, you will note that we have authors that go back to 1912. Some faculty are old, but not that old. We will go back at some point to see what is going on with that author.
With that in hand, we have all the necessary data to produce our paper chart component. In our web interface, we load this parquet file using duckdb as well, with as much of our computation as possible precomputed in that final preprocessing step. As such, we have a clear path from raw data to the front-end component.
Conclusion
This post sought to briefly introduce how to use dagster to implement PDP, going throught the necessary steps to produce our paper timeline chart. In the process, we showed how to ensure data availability by having an asset that check for it, write code as documentation, use a functional style of programming to keep track of our data wrangling, ... It is only a begginning. With dagster, we can easily automate the pipeline so that our web components stay updated. We can also check whether upstream files have changed, and only run when necessary. This become especially handy when we have modeling step, as with our Stan model, that are more computationaly expensive to run. We show all that in future posts, stay tuned!